At its best, our crime reporting informs and, as strange as it might sound, gives readers a sense of community on the Hill. It’s alienating to hear sirens and never know what happened. But it’s also easy to lose perspective. Is crime getting better or worse? Another robbery report, another person starts to believe things are going to hell on Capitol Hill. While the Seattle Police Department’s crime statistics only reveal so much, they are a good balance to the anecdotal coverage CHS reports on a daily basis.
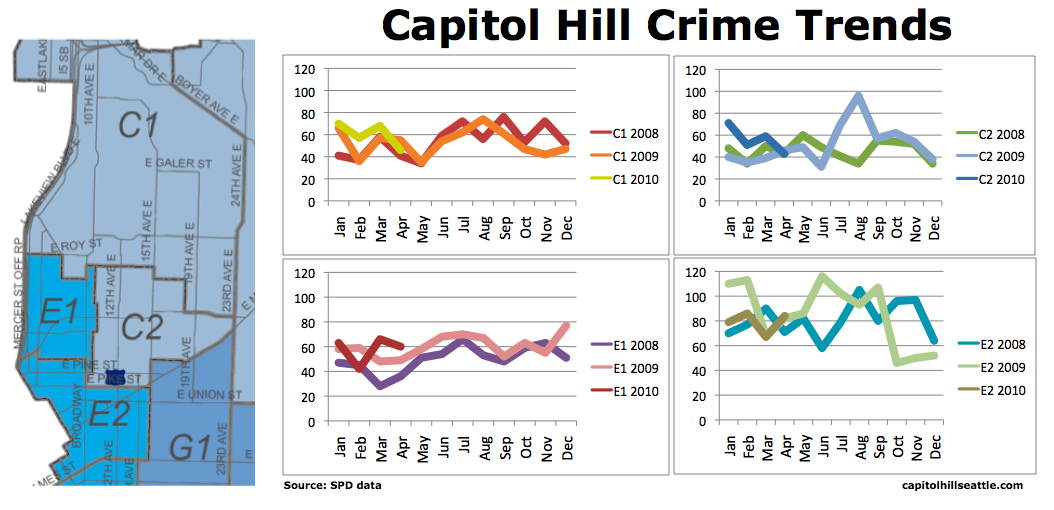
Here is a look at the first four month’s of data for the East Precinct’s Capitol Hill beats in 2010. You will find evidence of improvements and problem areas. Crime is up significantly in the Hill’s core driven by jumps in robberies, burglaries and thefts compared to the same periods in 2009 and 2008. Across the whole, violent crime is down while property crime has risen. Here are the details.
Digging deeper into the four beats that cover most of Capitol Hill (and parts of First Hill and the Central District), the first four months of 2010 weren’t good for the Hill’s core around Pike/Pine, Broadway and I-5 Shores as both beats C2 and E1 have seen a rise in total crime vs. 2009 and 2008. From the colorful fever lines, you can see how the month-to-month changes for those beats at least aren’t totally vertical but both beats continue to trend above past years. You can also, by the way, get a sense of what comes next given the trends we’ve seen in past years.
 Looking at the categories behind those trends continues the theme of property incidents driving Capitol Hill’s crime increases. C2 has seen a really big jump in thefts, especially. More disturbing might be E1’s slow but steady year over year climb in three of the five categories. We also shouldn’t let C1 and E2 decreases go un-noted. There are some problem spots in the numbers — climbing burglaries near First Hill for example — but the overall trends are looking much better than the rest of the Hill.

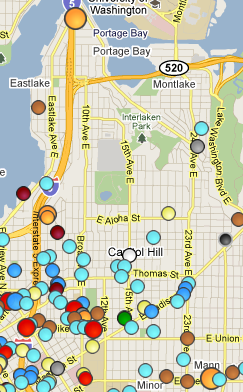
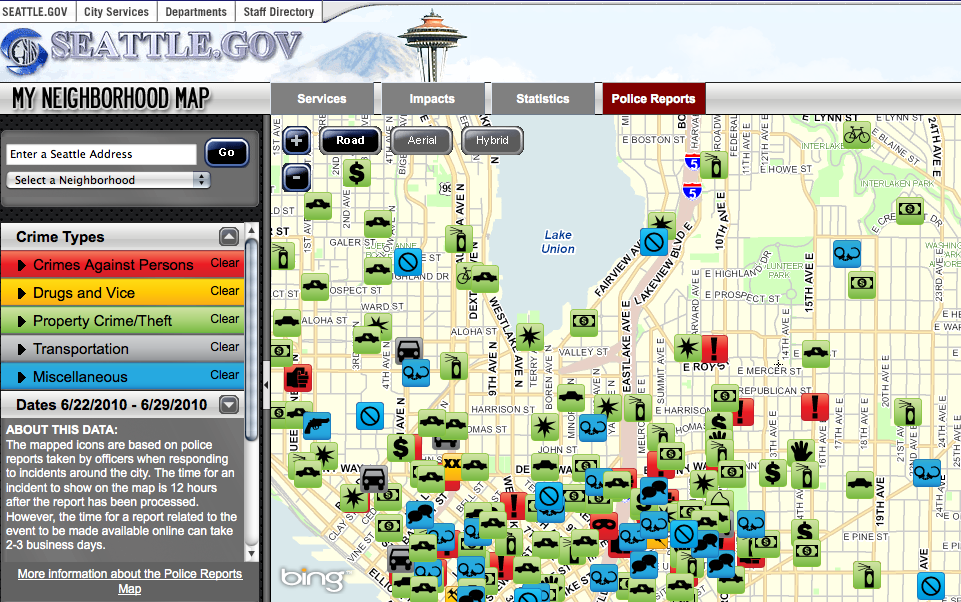
 Beyond the numbers, there’s now even more information on crime in Seattle and on Capitol Hill. SPD has started a new system to document its dispatches that is much like the (much loved by neighborhood news gatherers) Seattle Fire Department’s 911 page. The big difference is the SPD data is delayed (around 12 hours at this point) and they present the dispatches via a map format. You can see a screen grab of a recent look at Capitol Hill in the screen grab, below. To the right, you’ll see the familiar SeattleCrime dot map we utilize here on CHS on a regular basis.
We’ve begun collecting the new SPD dispatch data and including them on the SeattleCrime Map and in the iPhone App. In addition to the SPD dispatch info, the maps now include the full-text SPD reports that follow many of the dispatch events, SFD’s 911 incidents, content from SeattleCrime and citywide news partners and user-generated YouReports. That’s a lot of info.
And, oh yeah, we also have enabled comments on all of the items so people nearby can add information about what has happened. Think of it as that community thing coming full circle. Even with all the reports and data, the best way to feel connected and understand what is happening is talk amongst ourselves and figure it out.
Want to help cut into summer’s usual uptick in burglaries? Here is a video created by Central District News and a SPD crime prevention coordinator with tips for securing your residence:


Edward Tufte would be proud of how you displayed this data. I love your use of Small Multiples and Sparklines. Articles like this keep me coming back day after day.
As the previous gal/guy said, love the analysis. I work doing BI reports and this data analysis was nicely done! great job.
Sorry couldn’t resist — 2nd word in article should be “its.”
giant blush (guess my brain was busy with the numbers)