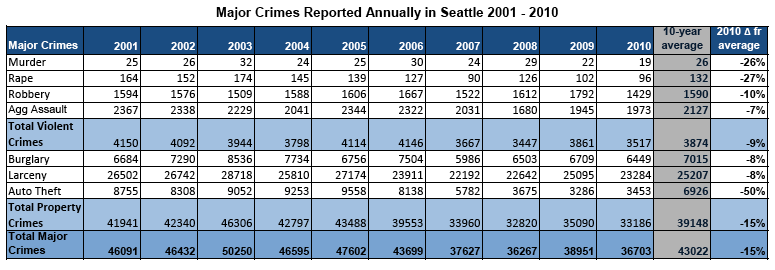
 Seattle Police Chiefs have been talking about 40-year-low crime rates since 2008. The city’s long-term statistical crime trends — due to a variety of factors not least of which is an ever-efficient police force — show numbers that indicate we live in an extremely safe city and that the streets of Seattle are in many ways as safe as they were in the 1950s. Which is to say you can still get assaulted or robbed on a walk home at night. These things happen. Overall in Seattle, the data tell you, they happened about 6% less often in Seattle in 2010. Our analysis of these things that happen looks inside the larger trends for changes on the streets of Capitol Hill in 2010. Here is what we found:
- An overall 6% increase in criminal events in the five main crime categories across the East Precinct beats that cover Capitol Hill driven by a 11% increase in theft
- A bounceback in robberies and vehicle theft after marked declines in 2009
- Big jumps in robberies in northern Capitol Hill and above Broadway
- A 2% decrease in overall crime in the southwest Hill/First Hill E2 beat
- A 40% explosion in burglaries in the E1 beat covering I-5 Shores below Broadway
First, here’s what SPD had to say about 2010 from a citywide perspective — you can get a larger, easier to read PDF version here.
Through December, Major Crimes were down citywide by 6% when compared with the 2009. The citywide crime trend in 2010 was different from that in 2009. By the end of 2009, there had been citywide increases in both Violent Crimes and Property Crimes. As of the end of 2010, Violent Crimes were down by 9% compared with 2009, led by a 20% decrease in robberies. Property Crimes were down by 5% across the City, with a slight increase only in vehicle thefts.
Adjusted for population, the crime rate per 1000 in 2010 was the lowest since 1967. The City also had the fewest homicides since 1956.
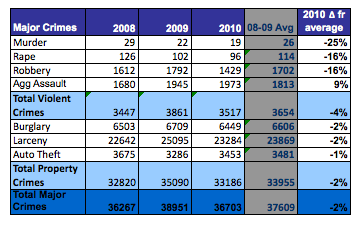
When comparing our dataset to SPD’s, keep in mind the City is using a 10-year average for comparison. We have beat data back through 2008 so our average value is for ’08-’09. Here’s a view of the total city grid using the same yearly averages as we do:
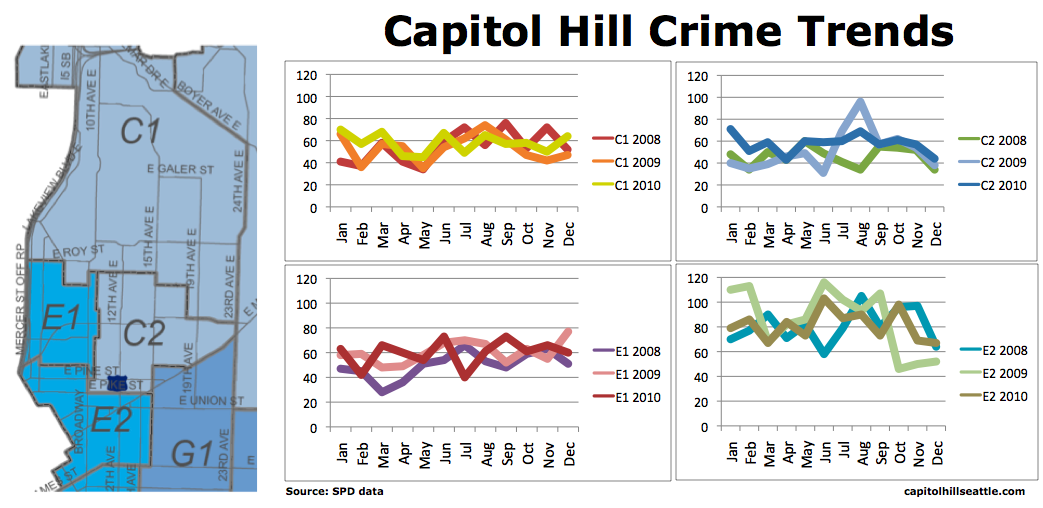
Compared to more recent trends, 2010 in Seattle still stacked up as safe overall. Here’s a look at how the four East Precinct beats that cover Capitol Hill fared.
- The overall trends for three of the four beats show very stable bands — the one outlier is E2 which had, it turns out, a remarkably low-crime 2009. We hope you enjoyed it.
- Northern Capitol Hill’s C1 beat had the biggest increase in robberies vs. the 2008-2009 average. The sample size is pretty small so it’s fair to say that the central Hill’s C2 probably gave it a run for its money.
- Central C2 beat turned in a whopping 12 more robberies than were recorded in 2009.
- C2 also clocked in the biggest increase in theft of any of the beats in 2010.
- The single biggest categorical increase in 2010 vs. the average was registered in burglaries in the area of the Hill between Broadway and I-5 above Pine. Incidents leapt from 75 and 76 in 2008 and 2009 respectively to 106 in 2010. That’s a 40% increase vs. the previous two-year total.
- For good news, the southwestern chunk of the Hill around lower Pike/Pine and First Hill saw drops in every main category we reviewed except theft. From a year over year perspective, one of the big improvements in the area was the decrease in burglary. Sorry about that, I-5 Shores
For more, here’s our look at 2009’s Capitol Hill crime trends.


