


Happy Election Day. As the votes are tallied and the election night parties prepared (oh boy, a Cap Hill election night party), here is a look at how the money got spent from a neighborhood point of view. All dollar totals below are from this Seattle Ethics and Elections Commission campaign contribution dataset. There are a lot more ways to cut the numbers — contribution totals, number of contributors, etc. — so please dig in to see what you can find.
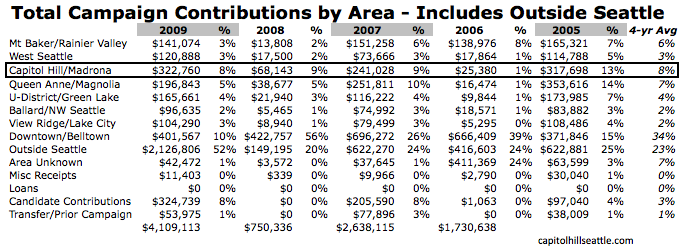
In an election with so much outside money entering the race — nearly $1.4 million from outside interests fighting Seattle’s bag tax — the dollar totals and trends for the city’s neighborhoods also tell some interesting stories. The city tracks these totals by ZIP code groupings so Capitol Hill totals are lumped together with our friends in Madrona and Madison Park. The Cap Hill group pitched in 8% of the total contributions for all campaigns this year. That’s a much lower relative total than the 13% of all contributions the Cap Hill group hit in the last mayoral election year in 2005 — but that’s a trend you see in every part of the city because of the huge influx of ‘Outside Seattle’ contributions in 2009.
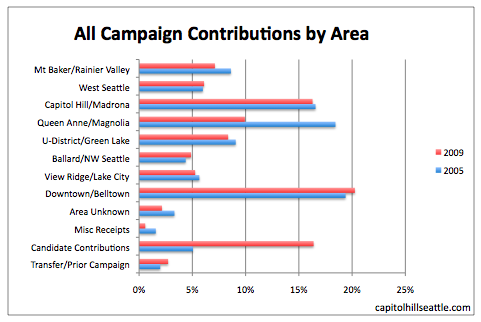
Excluding the Outside Seattle money as we have in the table and bar chart below gives a better view of the neighborhood trends across Seattle. The Capitol Hill ZIP group was second only to the Downtown/Belltown group in percent of contributions, laying down 16% of the campaign cash in the city. That’s right in line with what we did in the last mayoral election year. Meanwhile, as you can best see in the red and blue bar chart, Queen Anne/Magnolia and Mt. Baker/Rainier Valley showed the sharpest declines compared to their relative showing in 2005.
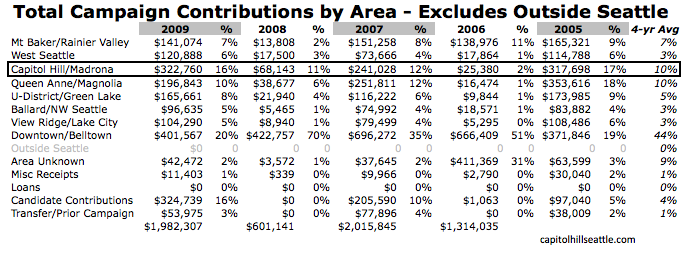
This view of the table also shows just how big a chunk of cash candidates contributed to themselves in 2009 — about 20% of the in-city total. Candidate contributions accounted for only 5% of the in-city campaign totals in 2005.
The dataset can also be chopped in several cuts to look at individual races and candidates.
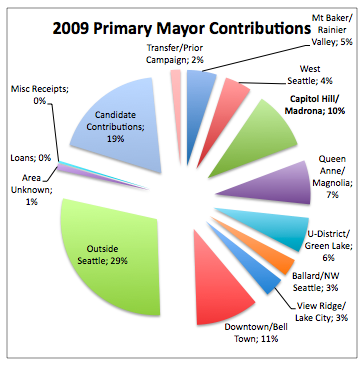
Here’s a look at some of the mayoral data we pulled for the four front-runners. First we calculated what percentage of contributions to all mayoral candidates the Capitol Hill group givers were responsible for — 10%. Then we calculated the totals for each of the four leading candidates for mayor. The Capitol Hill/Madrona group backed the front-runners — only Joe Mallahan’s contribution total from the area was below average but that’s mostly because the candidate poured so much of his own money — and got so much Outside Seattle money poured — into his campaign. The dataset also shows that the Capitol Hill/Madrona group was the second biggest contributing area in the city after the downtown business core.
Campaign Contributions by Area – Mayor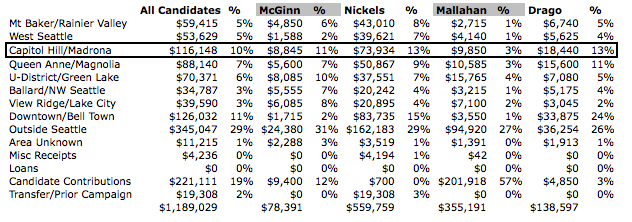
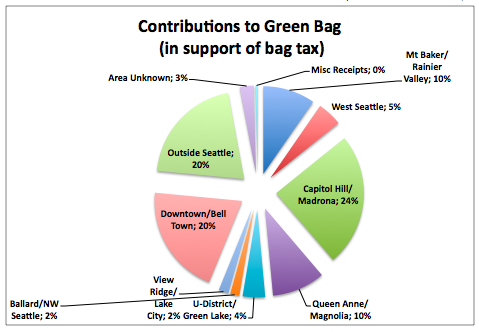
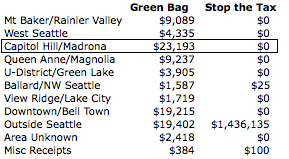
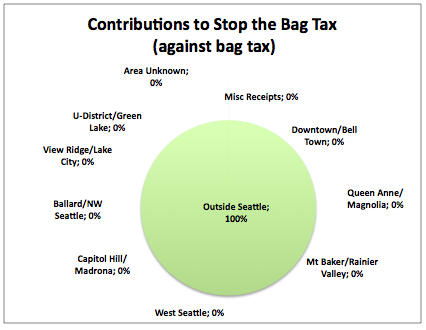
Finally, here’s a quick look at the money poured into the battle over a bag tax in Seattle. The top pie shows the breakdown of contributions to the pro-bag-tax group that raised about $94,000 for this campaign. The bottom pie shows the, um, breakdown of contributions to the anti-bag-tag group that raised more than $1.4 million to eliminate the tax.
 Still haven’t filled in your ballot? Here are some resources to help you out. No contribution required!
- CHS 2009 primary open endorsement thread
- 43rd District Democrats endorsements (no GOP endorsements on their site)
- The Stranger endorsements
- Publicola endorsements (by popular demand!)
- King County Elections official site: voter pamphlets, candidate videos and ballot tracker
- Nearest drop-box locations
Great work – interesting, candidates get VOTES and MONEY off The Hill. Most of us who do a lot of politics have long suspected these numbers.
Here is a new idea – do a chart about actual voting vs. population eligible vs. actual turnout. There is data, so I have been told, that says the 43rd has poor turnout stats……. do they? Compare to 36th and 37th and the W. Seattle outre monde provincals … I bet Queens and Westies all vote better that Haute Monde Hillers.
Cheers, again nice work Monsieur Justin.
(had a sweet dream in French last night, it is carrying forward, nice stuff for me)
None of the bag tax opposition money came from inside Seattle. Creepy.
Your chart isn’t entirely reflective of the table of data above it. The American Chemistry Council gave 1.4 million. The rest just doesn’t register with rounding.
I can’t help but wonder if people in Seattle only gave to the green bag side because of the large donation in support of opposing it. If the no camp hadn’t received 1.4 million I doubt we would see the green bag contributions at the neighborhood level.
I oppose the tax. I also bring my own bags to the store. I wouldn’t donate to either side.
I support the tax, and I am a future resident! I currently live in Arizona, if I had 1.4 million to spend I would give it to the Green bag campaign. I really, really hope that this bag tax passes. It won’t take away people’s option to pollute, it will just make them pay for it!
My first post was exactly accurate. Rejected by masses of voters. Oh I know, those dumb, stupid, fucking voters.
Little to do with the campaign, but a crappy law. The long and short is the wise voters say go to hell with such crap to the council and then, under intense scrutiny and much feedback, they try to not be so doofus and pass a good law, that works, and pleases the vast majority of citizens and taxpayers (democracy).
It can be done. Conlin, as green-ie Pres. of the Council, reeks in this fiasco. And shame will linger long over those other council members so asleep they voted for it.
You support a tax but this tax doesn’t support the environment.
Not that your vote would have made a difference given the overwhelming majority that rejected it.